Nifty 50 Chart Analysis (Apr 2, 2026) | Falling Wedge Forming, Reversal Signals in Focus

On April 2, 2026, the Nifty 50 index closed at 22,713.10 points, up a modest +33.70 (+0.15%) from the previous session. India's benchmark index recorded its steepest annual decline since COVID in FY26, falling approximately 4%. The escalating Iran-U.S. military conflict and surging crude oil prices have been the primary catalysts weighing on the market. This article analyzes the current state of the Nifty 50 through technical indicators and chart patterns. The following technical analysis is based on data as of April 2, 2026.
■ What Technical Indicators Show
Moving averages reveal a complete bearish alignment. The 5-day SMA (SMA5) stands at 22,769.99, the 25-day SMA (SMA25) at 23,810.04, the 75-day SMA (SMA75) at 25,109.56, and the 200-day SMA (SMA200) at 25,207.26. All major moving averages are aligned in descending order — a "reverse perfect order" — and the price trades below every single one. The deviation from SMA25 is -4.61%, and from SMA75 it is -9.54%, indicating significant divergence from medium- and long-term averages.
The RSI (Relative Strength Index, a momentum oscillator measuring overbought/oversold conditions over 14 periods) reads 37.48. While the oversold threshold is 30, the current reading places Nifty firmly in bearish territory and approaching the oversold zone.
The MACD (Moving Average Convergence Divergence) is at -637.64, with the signal line at -614.94 and the histogram at -22.70. The MACD remains deep below the zero line with the histogram expanding in negative territory, confirming strong downward momentum.
■ Bollinger Bands and Volatility
The Bollinger Bands show the upper band (+2σ) at 24,818.37, the middle band at 23,440.15, and the lower band (-2σ) at 22,061.93. The bandwidth is 11.76%, well above the normal range of 5-10%, indicating elevated volatility. The current price of 22,713.10 sits near the lower band at 22,061.93, raising both the possibility of a band walk (price hugging the lower band in a strong downtrend) and a potential bounce from this support zone.
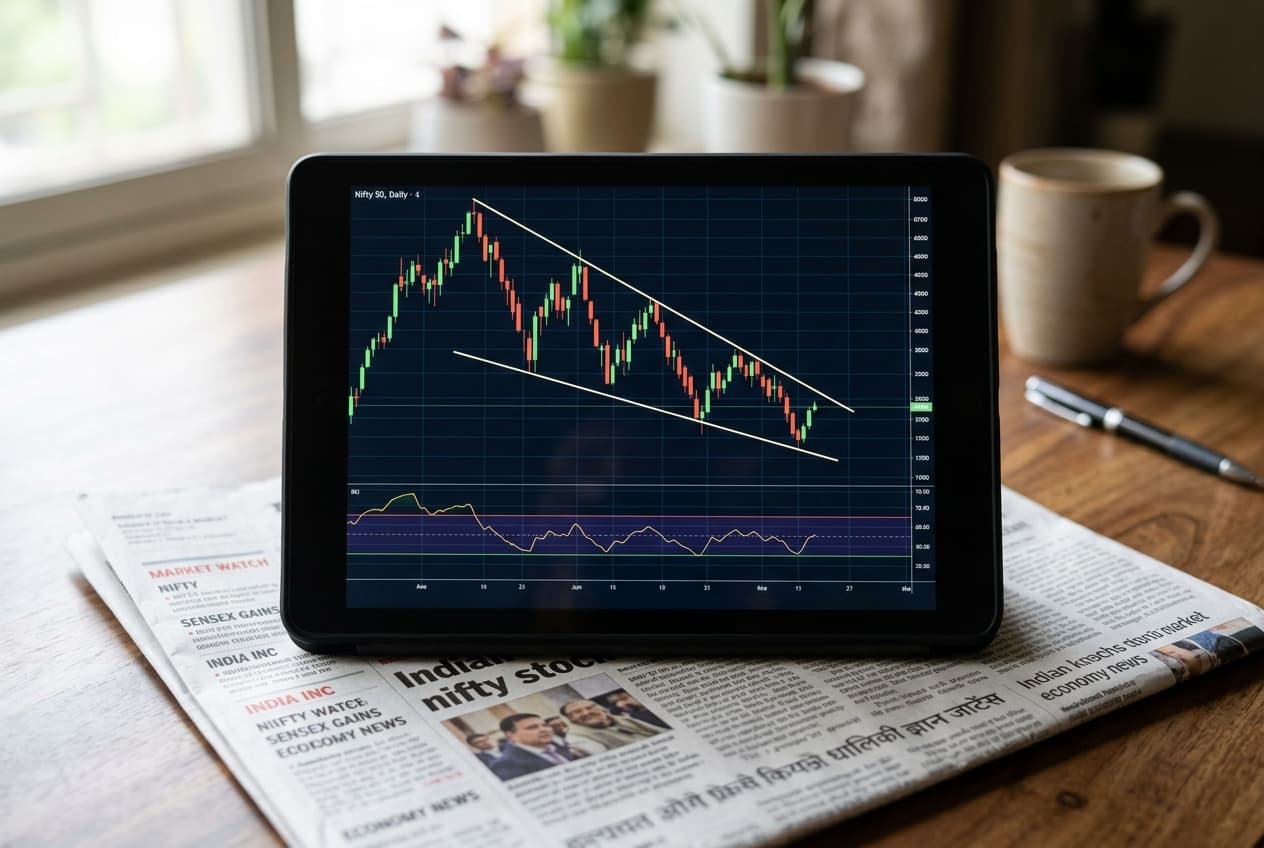
■ Chart Pattern Analysis: Falling Wedge
Recent price action suggests the formation of a falling wedge — a pattern where both highs and lows decline, but the upper trendline descends more steeply than the lower one, causing the two lines to converge. The upper trendline traces from the period high of 26,373.20, through 23,306.45 (March 25), to 22,713.10 (April 2), declining sharply. The lower trendline runs from near the March 25 low, through approximately 22,284 (March 30), to the April 2 low of 22,182.55, declining more gradually. This convergence is the hallmark of a falling wedge.
According to Bulkowski's "Encyclopedia of Chart Patterns," falling wedges break upward 68% of the time with an average post-breakout rise of 38% (based primarily on U.S. market data; results may differ in the Indian market). Importantly, the falling wedge is a reversal pattern that typically forms during downtrends and resolves with an upward breakout. Nifty's current position at 12.66% of the recent range (very near the bottom) aligns with the pattern's characteristics. You can learn more about this pattern on Chart Master's pattern detail page.
■ Support and Resistance Levels
Pivot point analysis for April 2 shows R1 at 22,936.08 and R2 at 23,159.07. On the downside, S1 is at 22,336.33 and S2 at 21,959.57. The psychological level of 22,000 serves as a critical support, with the market consensus trading range for the week of April 6-10 set at 22,000 (support) to 23,200 (resistance).
Fibonacci retracement levels (based on the 60-day range of 22,182.55 to 26,373.20) place the 23.6% level at 23,171.54, the 38.2% level at 23,783.38, and the 50% level at 24,277.88. The Ichimoku Cloud shows the tenkan-sen at 22,823.95 and kijun-sen at 23,977.00 in bearish alignment, with price positioned below the cloud — a continued bearish signal.
■ Volume and Market Sentiment
Volume on April 2 was 495,100, with the 20-day average at 522,480 — a ratio of 0.95, indicating normal activity. The absence of a volume spike suggests no panic selling has occurred, but equally, no aggressive buying is taking place.
The Stochastic oscillator shows %K at 31.59 and %D at 17.86. Notably, %D has entered the oversold zone (below 20), which can serve as an early signal for a short-term bounce. Sector-wise, auto and pharma stocks have led the decline, while IT stocks have shown relative resilience. Banking and NBFC (Non-Banking Financial Company) stocks have faced intense selling pressure. FII (Foreign Institutional Investor) outflows are accelerating, dampening overall market sentiment.
■ Key Catalysts and Market Environment
The dominant force shaking the Indian market is the escalating Iran-U.S. military conflict. The war has driven crude oil prices sharply higher. India, the world's third-largest crude oil importer, is particularly vulnerable — higher oil prices widen the current account deficit and put downward pressure on the rupee. A weaker rupee in turn raises import costs, creating a vicious cycle. The rupee's weakness adds further pressure as crude oil imports become more expensive in domestic currency terms.
Since the war began in March, the Nifty 50 has declined 13-15%, severely eroding investor confidence. Multi-timeframe analysis confirms that daily, weekly, and monthly charts all show a strong downtrend with alignment set to TRUE. While this unified bearish alignment underscores the trend's strength, it also sets the stage for a powerful reversal when the trend eventually turns.
■ Outlook and Scenarios
Bullish Scenario (Falling Wedge Upward Breakout): The price breaks above the upper trendline of the falling wedge. A clear move above R1 at 22,936.08 toward the Fibonacci 23.6% level at 23,171.54 would be the initial confirmation signal. A further push through R2 at 23,159.07 and the tenkan-sen at 22,823.95 would target the Fibonacci 38.2% at 23,783.38. Bulkowski's statistics support a 68% probability of upward breakout. De-escalation of Iran tensions or stabilizing oil prices could serve as catalysts, and the Stochastic %D already in oversold territory provides a contrarian signal.
Bearish Scenario (Support Breakdown): A break below the 22,000 psychological support would bring S2 at 21,959.57 into play as the next defensive line. The falling wedge could fail as a reversal pattern (32% probability per Bulkowski). A breach of the Bollinger lower band at 22,061.93 would suggest a band walk lower. Further crude oil spikes and accelerating FII outflows represent key downside risks.
Neutral Scenario: Range-bound trading between 22,000 and 23,200 continues as the wedge converges further. A decisive volume-backed breakout would be needed to establish a clear direction.
■ Summary
Technical indicators are predominantly bearish — a reverse perfect order in moving averages, RSI at 37.48, and deeply negative MACD all point to continued downward momentum. However, the forming falling wedge (a reversal pattern), Stochastic %D at 17.86 in oversold territory, and Bulkowski's 68% upward breakout probability present a constructive counter-narrative. Key price levels to watch are 22,000 (psychological support) on the downside and R1 at 22,936.08 / Fibonacci 23.6% at 23,171.54 on the upside. The direction of the wedge breakout and developments in the Iran conflict and crude oil markets will be the decisive factors.
※ This article is for informational purposes based on technical analysis and does not constitute a recommendation to buy or sell any specific security. All investment decisions should be made at your own discretion and risk. Technical indicator values are based on analysis script output as of April 2, 2026.