Nikkei 225 Chart Analysis (May 18) | Three Black Crows Complete -593 Yen, Full Corrective Phase Begins
The following technical analysis is based on data as of May 18, 2026.
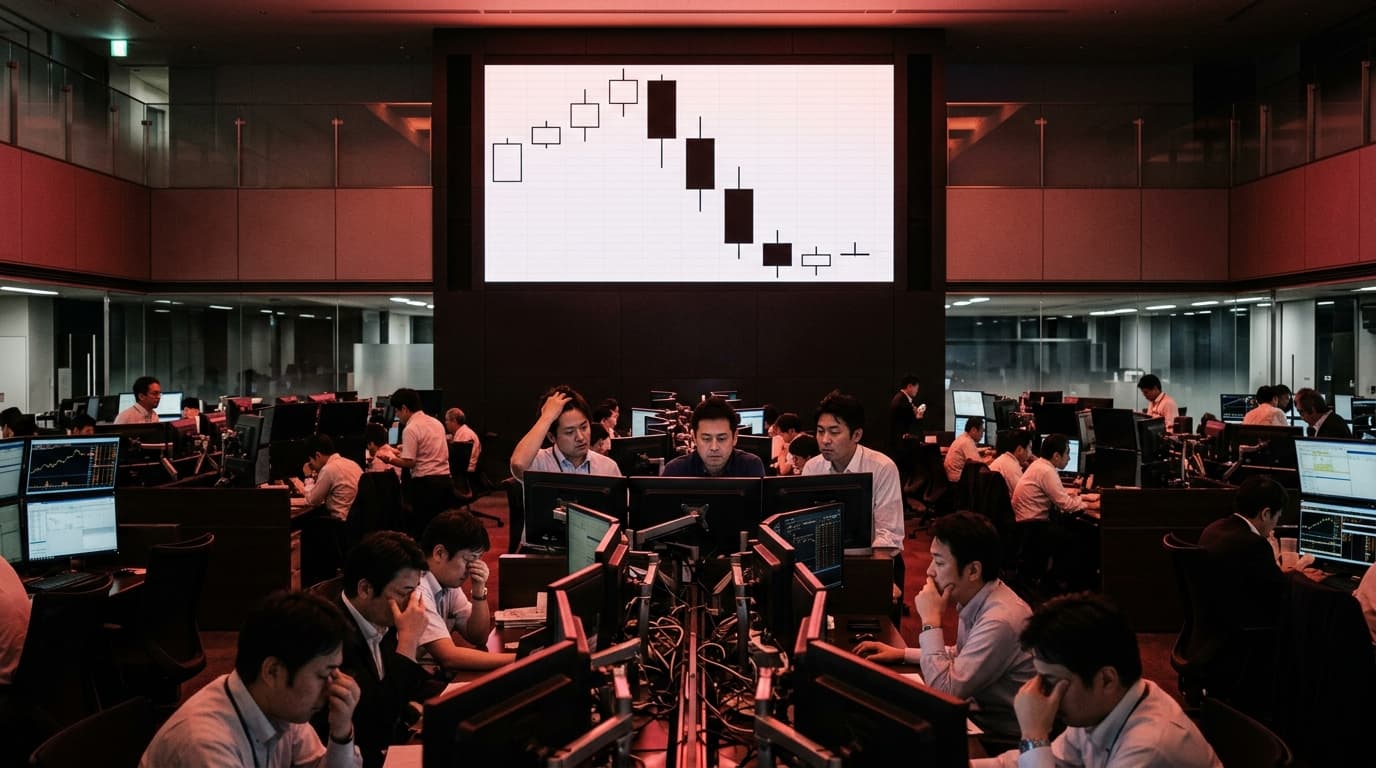
The Nikkei 225 closed at 60,815.95 yen on May 18, falling 593.34 yen (-0.97%) for a 3rd consecutive decline since 5/14's closing marubozu. Open 61,299.87, high 61,478.55, low 60,376.98, close 60,815.95. A 484-yen midsize bearish body with 179-yen upper shadow and 439-yen lower shadow. The 3 consecutive bearish candles of 5/14, 5/15, and 5/18 complete Steve Nison's three black crows reversal continuation pattern, signaling full corrective phase entry.
■ Technical Indicators
Moving averages: SMA5 62,178.79, SMA25 59,774.60, SMA75 56,407.68, SMA200 50,812.34. Close 60,815 broke about 1,363 yen below SMA5 — short-term support broken continues. SMA25 deviation +1.74% (vs prior +3.25%) — further rapid contraction; SMA75 deviation +7.82% — rapid overheating relief.
RSI 55.90, down from 59.10, approaching neutral 50. Significant decline from 70 overbought — pronounced overheating relief. MACD 1,582.83 / signal 1,683.23 / histogram -100.41. Histogram first turn to negative from +49.76 — MACD dead cross occurs, trend reversal signal triggered. Stochastic %K 42.38 / %D 58.03 — both below 50, full overheating relief phase. Ichimoku: thick bullish cloud maintained, price above cloud — three-fold bullish maintained, but tenkan 61,531 is the key near-term level.
■ Bollinger Bands
Upper 63,803.12, middle 60,542.85, lower 57,282.58, bandwidth 10.77%. Today's close 60,815 holds just above middle line 60,542 — pullback from +2 sigma to middle completed. Bandwidth narrowed from 11.45% to 10.77%. Middle line 60,542 becomes next key support.
■ Chart Pattern Analysis: Three Black Crows
Today's candle completes a 3-candle three black crows pattern. Conditions: (1) 3 consecutive bearish candles, (2) successively lower closes, (3) each open within prior body, (4) closes near lows. Here: (1) 5/14, 5/15, 5/18 three consecutive bearish (✓), (2) closes 62,654→61,409→60,815 progressively lower (✓), (3) each open within prior body (5/15 open 62,878 inside 5/14 body 62,654-63,263, 5/18 open 61,299 inside 5/15 body 61,409-62,878) (✓), (4) 5/14 close = low (closing marubozu), 5/15 close 61,409 +472 above low, 5/18 close 60,815 +439 above low — partial fit. Bulkowski's three black crows reversal continuation rate around 58%, especially powerful at new-high regions as topping signal.
■ Support and Resistance

60-day range: 50,558.91 to 63,799.32. Today's close at 77.47%. Resistance: 61,478 (today's high), 5/15 low 60,937 (former support, now resistance), SMA5 62,178, psychological 61,000. Support: 60,376 (today's low), Bollinger middle 60,542, psychological 60,000, SMA25 59,774, 5/7 open 60,241.
■ Volume and Sentiment
Volume 168.1 million versus 20-day average 167.77 million yields 1.00x — at average (normal). 3-day decline final day completing at average volume suggests institutional risk-off may be stabilizing. Multi-timeframe stays all strong uptrend with full alignment.
■ Market Environment
From the post-GW historic surge phase (5/7 +3,320 yen), the sequential reversal signals of 5/14 closing marubozu → 5/15 three inside down → 5/18 three black crows make the trend reversal clear. Overseas markets, FX, US indices, and late-earnings responses determine the depth of the correction.
■ Outlook and Scenarios
Bullish: Reclaim of psychological 61,000 / SMA5 62,178 invalidates three black crows; simultaneous break above 5/15 low 60,937 brings full rebound. Bearish: Break below Bollinger middle 60,542 / psychological 60,000 brings full corrective phase, with SMA25 59,774 / Fibonacci 61.8% (around 56,952) pressure. Neutral: 60,000-61,500 range while overheating fully resolves.
■ Summary
May 18 three black crows completion lights up the full reversal signal of the post-5/7 historic-surge phase. Key levels: upside 61,000 / SMA5 62,178, downside 60,376 / 60,000 / SMA25 59,774. Whether psychological 60,000 holds and middle line 60,542 defends will determine the short-term inflection.
* This article provides information based on technical analysis and does not constitute a recommendation to buy or sell any specific security. Investment decisions are your own responsibility.